Read more
Football fans and analysts around the world know that a team’s passing accuracy and shot accuracy can make all the difference in a match. As a data analyst, I recently had the opportunity to analyze the first half of Pakistan vs Bangladesh SAFF Women’s Championship match. Using Tableau visualizations, I have created a detailed breakdown of the match events, team passing accuracy, and team shot accuracy. In this blog post, we will explore these visualizations to gain insight into the game and the strategies of both teams.
Match Events
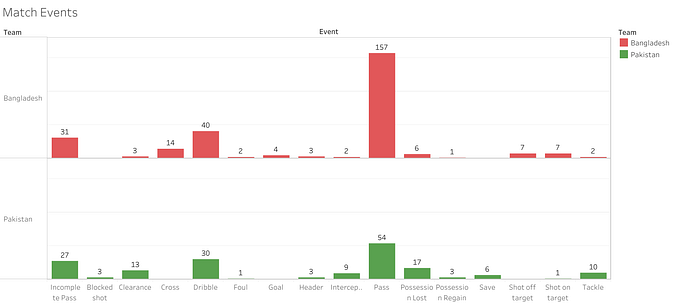
When we talk about match events, we refer to a wide range of actions that take place during a football match. These events include complete passes, incomplete passes, clearances, crosses, dribbles, fouls, goals, headers, interceptions, possession lost, possession gain, saves, shots off target, shots on target, tackles, and more.
In the first half of Pakistan vs Bangladesh SAFF Women’s Championship match, we analyzed these match events using Tableau visualizations to gain insights into the teams’ performance. The visualizations allowed us to break down the match events, team passing accuracy and team shot accuracy to understand how the teams were performing in different areas of the game.

The match events statistics reveal some interesting insights about the gameplay of both teams. Bangladesh had a higher number of shots on target and off target compared to Pakistan, with a total of 7 shots on target and 7 shots off target. Additionally, Bangladesh Completed more passes with a total of 157 passes, with an accuracy of 84%. On the other hand, Pakistan had a higher number of tackles compared to Bangladesh, with a count of 10 tackles. Pakistan also had a higher number of clearances with a count of 13, indicating that they were more defensively oriented during the game. Overall, both teams had relatively balanced gameplay in terms of match events, but Bangladesh’s higher number of shots on target and goals scored gave them the edge over Pakistan.
Pass Maps
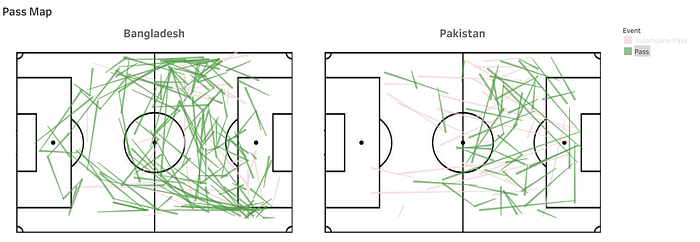
Team passing accuracy is an important metric to measure the performance of a football team. It provides insights into how effectively a team can maintain possession, build up attacks, and create goal-scoring opportunities. In the following screenshots, we can see the distribution of complete and incomplete passes for both teams in the match between Bangladesh and Pakistan.


By analyzing these metrics, we can gain a better understanding of the passing performance of each team during the game. The graphs display the passing accuracy of each team and their distribution of successful passes across the pitch, as well as the areas on the pitch where each team made the most incomplete passes, allowing for a closer analysis of their passing strategies and weaknesses.
Shot Maps
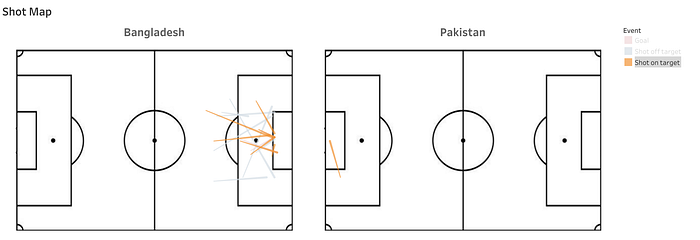
The third set of visualizations provides a breakdown of goals, shots on target, and shots off target by Pakistan and Bangladesh in the first half. By analyzing these maps.


The shot maps reveal a clear difference in the attacking strategies of both teams. Bangladesh had a much higher number of shots on target and off target compared to Pakistan, with a total of 7 shots on target and 7 shots off target. This high number of shots on target indicates that Bangladesh had more opportunities to score goals and put pressure on Pakistan’s defense.
In contrast, Pakistan only had one shot on target throughout the entire game, which was taken inside the box. This indicates a lack of penetration in the opposition’s defense and a weaker attacking strategy overall. Additionally, the shot maps reveal the location on the pitch where each team made their shots, allowing for a closer analysis of their attacking strategies and weaknesses.
Conclusion
analyzing a football match using data-driven approaches provides valuable insights into the gameplay of teams. By analyzing match events, team passing accuracy, and the team shot accuracy, we can gain a better understanding of the strengths and weaknesses of each team. In this blog post, we analyzed the first half of the Pakistan vs Bangladesh SAFF Women’s Championship match using Tableau visualizations to gain insights into the game and the strategies of both teams. Through our analysis, we found that Bangladesh had a stronger attacking strategy than Pakistan, with a higher number of shots on target and goals scored. We also analyzed the passing accuracy of both teams and identified areas on the pitch where they made incomplete passes, allowing for a closer analysis of their passing strategies and weaknesses. The data-driven approach helps us understand the game more objectively and provides useful insights to football fans and analysts alike. By continuing to analyze matches using data-driven methods, we can gain even more insights into the world of football and the strategies of top teams.


0 Reviews